Automated Monthly Statistics
We've added automated monthly statistics that track what's happening across the Open Tibia ecosystem. Every month on the 1st, a new report gets generated automatically with detailed data about servers, players, and activity patterns.
The reports cover everything from server counts and player retention to peak activity times and geographic distribution. Starting next month, each report will also include comparisons to the previous month so you can see how things are changing over time.
What's in the reports
Each monthly report includes comprehensive statistics across several key areas. Here's what you'll find:
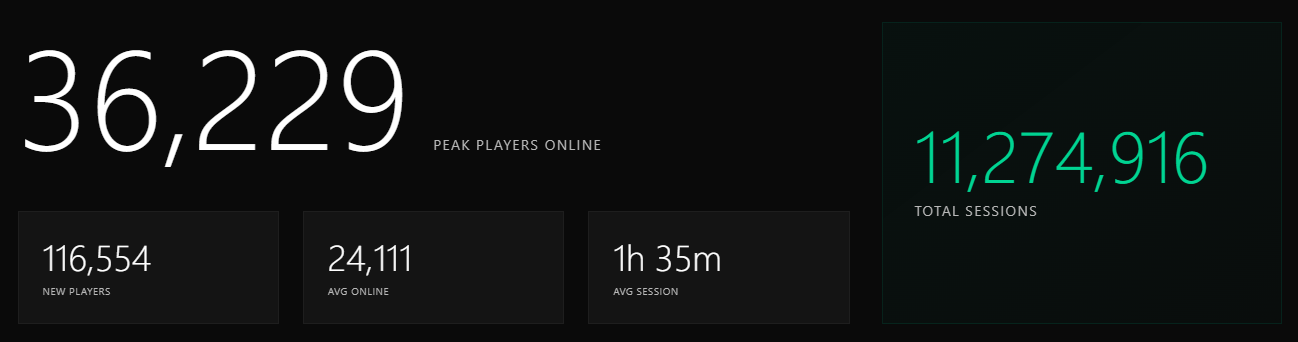
General Overview
The report starts with the most important numbers - peak players online, new players this month, average online count, average session duration, and total sessions. These metrics give you a quick snapshot of the month's activity.
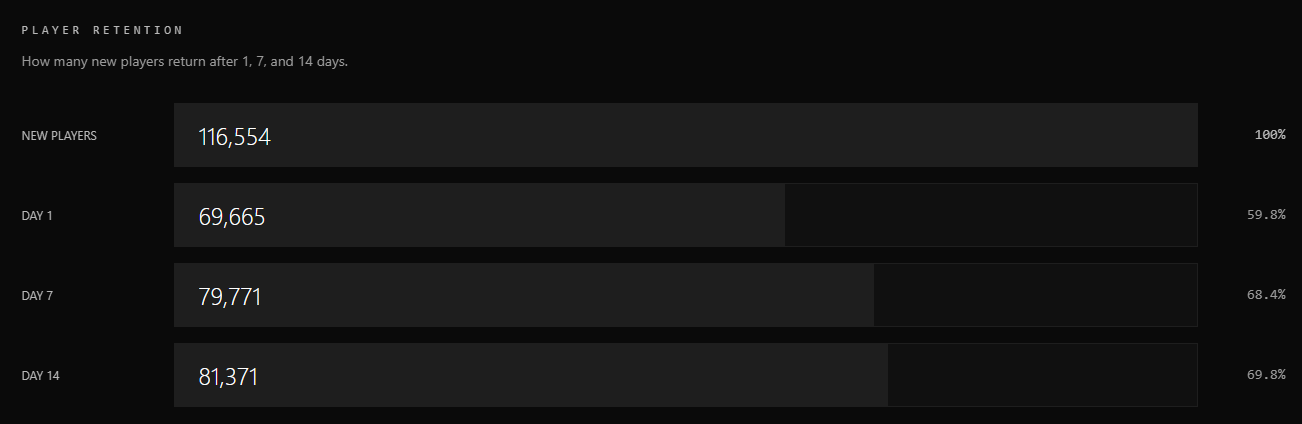
Player Retention
We track how many new players joined, how many came back, and overall retention rates. This shows how healthy the community is and whether servers are keeping players engaged.
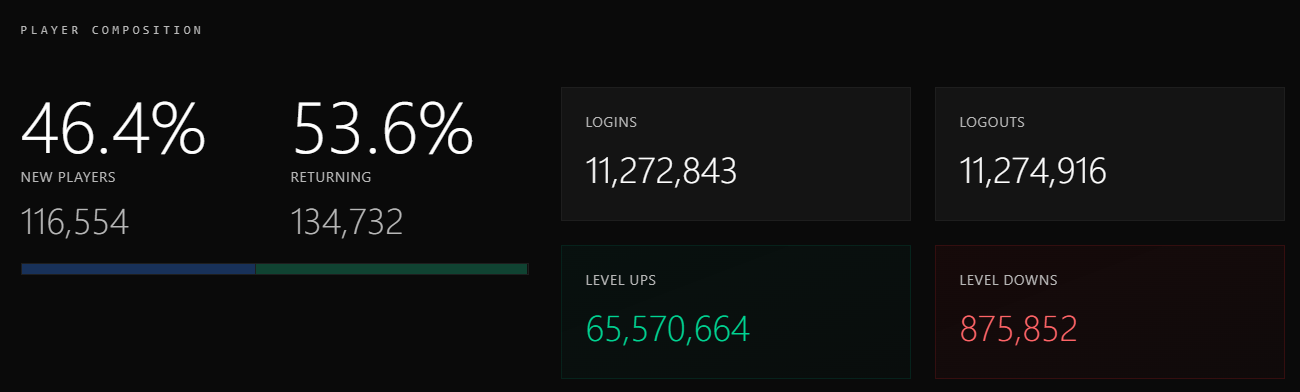
Player Composition
This breaks down the player base by different categories - new players, returning players, and active regulars. You can see how the community composition shifts month to month.
Top Countries
Geographic distribution showing which countries have the most active servers and players. The Open Tibia community is global, and this shows exactly where everyone is.

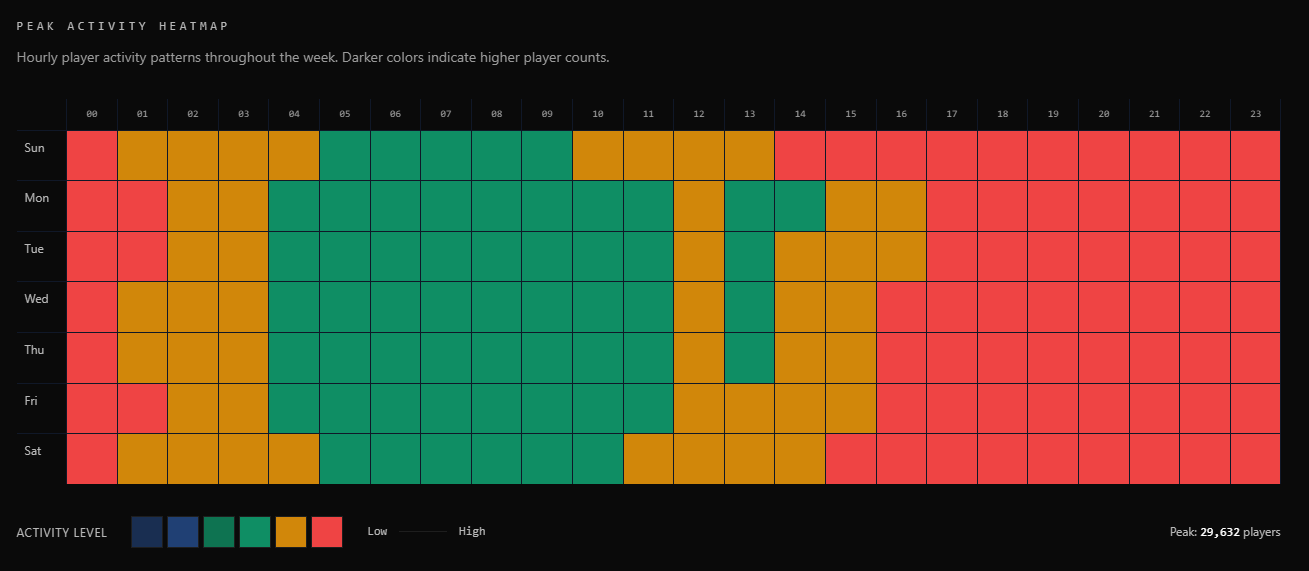
Peak Activity Heatmap
A heatmap showing when players are most active throughout the week. You can see exactly which hours and days have the highest activity across all servers.
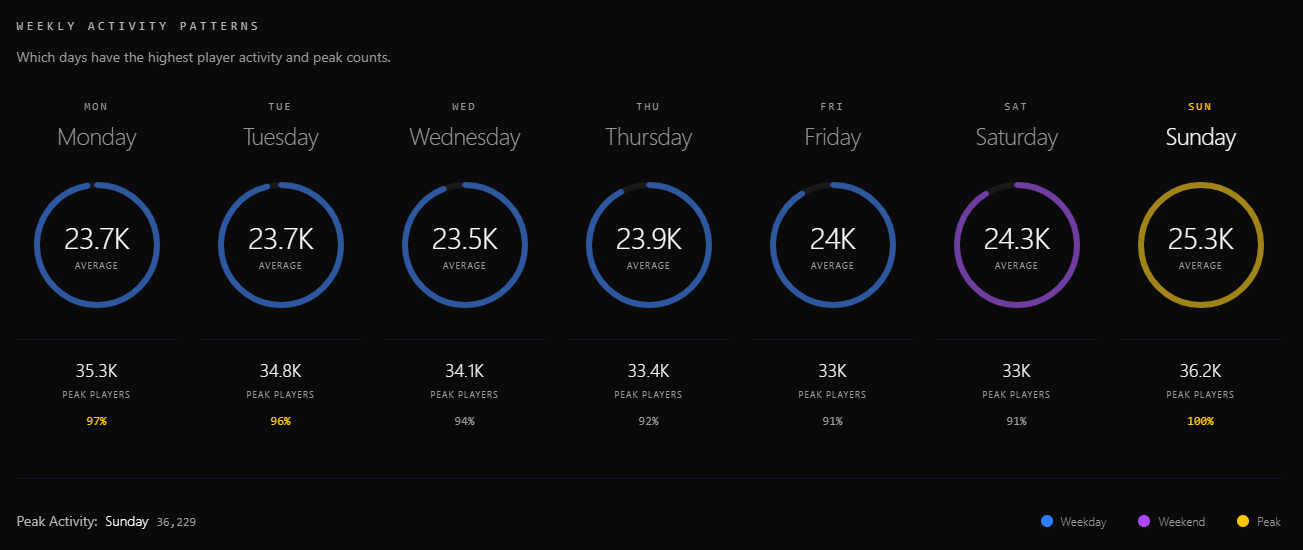
Weekly Activity Patterns
Charts showing how activity fluctuates throughout the week. This helps identify trends like weekend spikes or weekday patterns.
Client Versions
Distribution of which Tibia client versions are being used across servers. This shows which versions are most popular and how adoption changes over time.

New design preview
The statistics page also features our new design system that we'll be rolling out across otservers soon. It's cleaner, more readable, and works better on all devices. You'll see this design gradually appear throughout the site over the coming months.
Check it out
Head over to /servers/statistics/monthly to browse all the reports. The first one covers November 2025, and we'll keep adding new ones automatically every month.